How I Work
Lab: AI & Automation in Practice
I operate my entire marketing stack through AI — connecting tools via MCP, debugging emails with Claude Code and Codex, generating creative with Gemini AI Studio, and reporting through Grafana dashboards wired via API.

Real-Time Analytics Pipeline
Instead of weekly CSV exports, MCP connectors pull live data from Google Analytics and Search Console directly into my workflow. AI tags and categorizes automatically. Dashboards update in real time — marketers see what's moving without digging through spreadsheets.

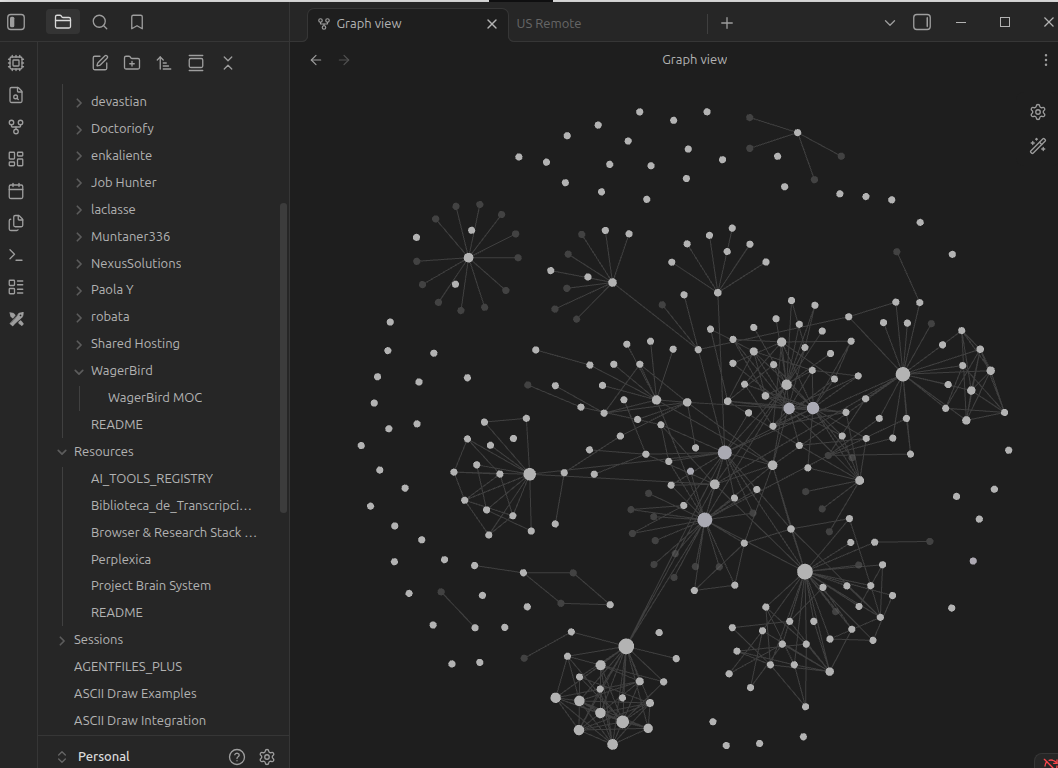
AI as the Control Layer
I control my marketing stack through AI terminal — connecting GA4, WordPress, Make.com, and ESPs via MCP. Debug emails with Claude Code and Codex. No engineers needed, no context-switching between platforms.
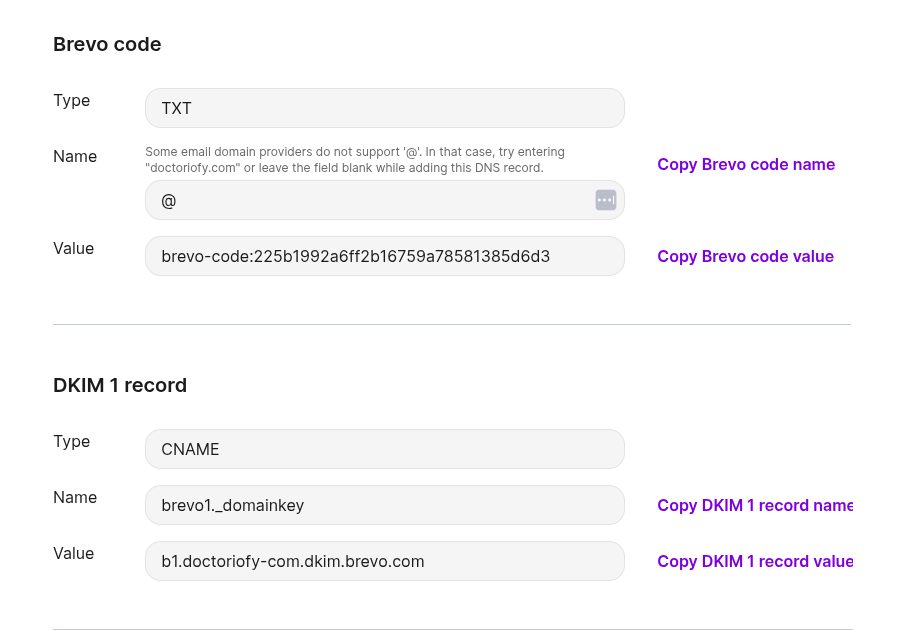
Deliverability & Automated QA
"Verify-Then-Send" system using Playwright and Claude Code. Plus DNS-level deliverability management — SPF, DKIM, DMARC configuration for inbox placement.

AI-Powered Data Analysis
I use Claude AI to analyze campaign fatigue, identify churn patterns, and interpret performance data at scale. AI-assisted forensics that surface insights spreadsheets miss.
Grafana + API Reporting
Real-time marketing dashboards built on Grafana, connected to data sources via API. Campaign performance, revenue tracking, and engagement metrics — all wired through the AI terminal without manual data pulls.
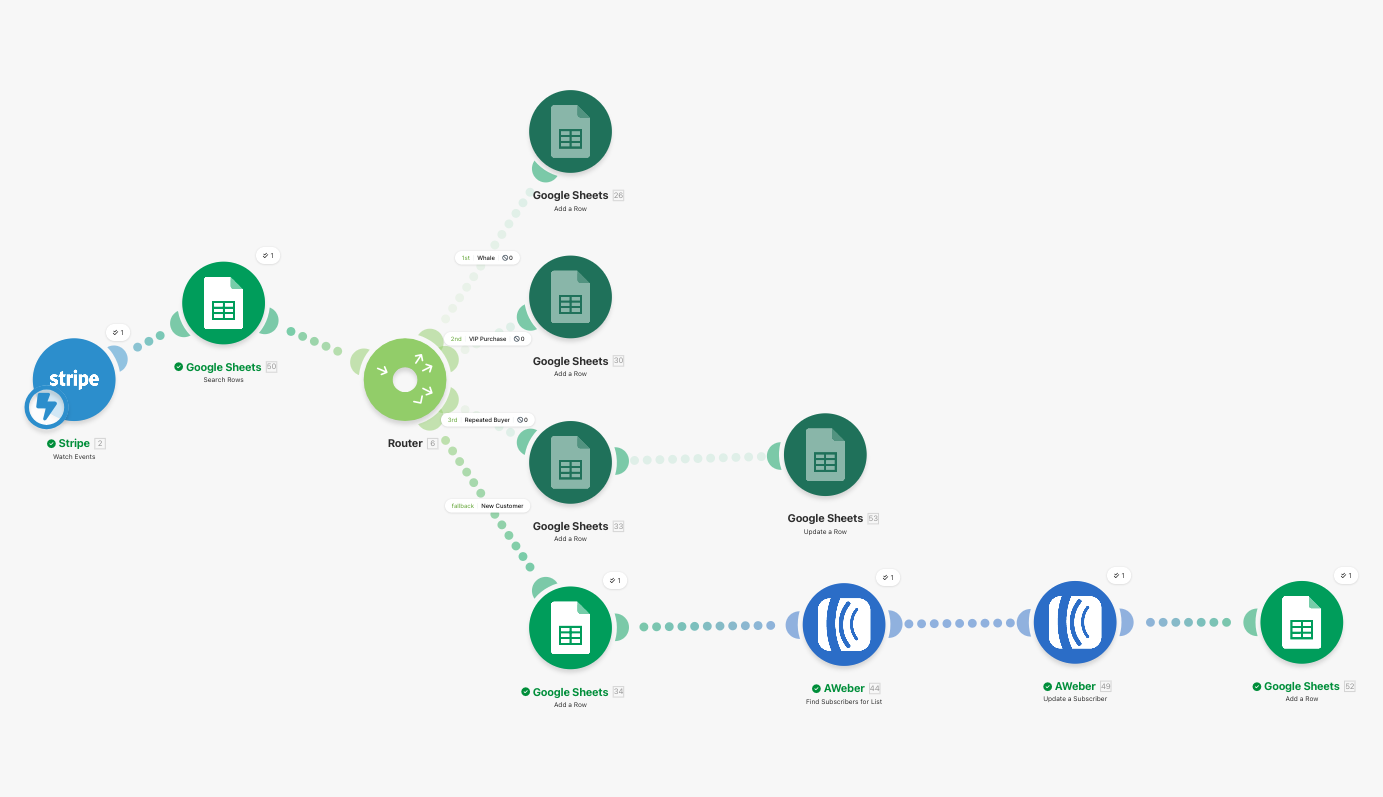
Workflow Automation
Complex conditional routing in Make.com. When Stripe fires a purchase event, the system looks up history, checks buyer type, and routes to the correct drip. Zero manual intervention.

Responsive Email Development
Built and tested responsive email templates for WagerBird. Verified rendering across mobile clients and email platforms. Combined HTML/CSS email coding with automated QA to ensure every send looks correct.